ServiceNow Analytics and Reporting Integrations

By integrating ServiceNow with analytics and reporting tools, organizations can use their preferred solution to analyze their data. This extends reporting and analysis capabilities, and means ServiceNow data can be merged with other data sources for more comprehensive, enterprise-wide analysis.
The modern business ecosystem runs on data. While organizations can now easily collect data, extracting that data to merge it with other sources and/or replicating data to best-in-class reporting and analytics tools remains a challenge. Particularly so for the ServiceNow platform – from which data is difficult to extract.
For many organizations, ServiceNow data is often siloed from the wider enterprise, such that other teams/stakeholders cannot access ServiceNow’s insights to drive actionable change.
Without a reliable means of extracting ServiceNow data, organizations must rely on ServiceNow’s own reporting and analytics capabilities.
Using the Now platform’s native analytics and interactive dashboards, enterprises can predict trends based on present and historical data and make decisions accordingly.
However, ServiceNow reporting and analytics come with limitations. For instance, the data analyzed is confined to ServiceNow data, and you can only access up to 180 days of historical data.
To overcome these limitations, organizations integrate ServiceNow with third-party reporting and analytics solutions. More on this later …
But first, let’s explore ServiceNow’s reporting and analytics capabilities:
What is ServiceNow Reporting?
ServiceNow Reporting lets you create and distribute reports on your ServiceNow instance’s data (e.g., the number of open incidents per priority). This functionality is available by default for all tables except system tables.
The Now platform also includes a range of predefined reports containing app information, including administration catalog demands and occurrence executions.
Since these reports have vital business information, you can present them to clients on dashboards or administration portals and share them via email as PDFs.
You can use ServiceNow Reporting to generate different reports, like –
- Bar reports help compare scores across data dimensions
- Pie & Donut reports visualize the relationship between data parts (or as a whole) using shapes (like pies).
- Time Series reports help visualize data over time. Here, you can also use MetricBase data apart from instance data and imported data sources.
- Multidimensional reports to present data across dimensions in a table/graph
- Scores can visualize single data points across ranges or as a single value.
- Statistical reports visualize data with statistical values (medians, means, etc.)
Apart from these reports, you will also have access to calendars, maps, and lists.
What is ServiceNow Performance Analytics?
ServiceNow Performance Analytics (PA) allows you to foster a “goal-oriented business culture” by empowering you with an easy-to-use, integrated app for analyzing, reporting, and visualizing business performance.
It has 600 predefined KPIs to analyze and measure the Now platform’s operations. In addition to powerful analytics, Performance Analytics also includes interactive dashboards and advanced drill-downs to help you extract meaningful insights from business data.
Performance Analytics helps –
- Forecast trends
Responsive dashboards let you monitor and analyze historical and current data to predict future market trends and identify new business opportunities.
- Facilitate process automation
You can quickly identify the scope of automation and self-service in existing processes to boost efficiency, improve quality, and reduce costs.
- Prioritize needs
Analytical reports let you deep-dive into internal processes and identify the topmost business priorities. So, C-suite executives and stakeholders can align their decisions to allocate resources and efforts to the right areas.
- Foster continual growth and improvement
Advocate for progress and take action on KPIs using Analytics Hub, time charts, forecasts, breakdowns, and dashboards
The Limitations of ServiceNow Performance Analytics and Reporting
While ServiceNow’s reporting and analytics capabilities may suffice for some organizations, data-driven, enterprise scale organizations often need more robust reporting tools.
They need the ability to extract ServiceNow data from its silo within the platform and merge it with other sources. To achieve this, organizations integrate ServiceNow with third-party solutions.
Though you can analyze ServiceNow data using the Now platform’s reporting and performance analytics, the data remains siloed (cut off) from the wider enterprise. Since the data is not in context, it limits the possibility of obtaining valuable insights.
Additionally, ServiceNow reporting has its intrinsic limitations:
- It is challenging to monitor and visualize the relationship between dates, data groupings, determined fields, defined reports, etc. Say, if you wish to visualize the link between the average first reaction time to a Priority 1 occurrence and the chance of its resolution in 60 minutes, you need a ServiceNow PA expert.
- Though you can create custom diagrams and representations for reporting, you may need to rely on JavaScript or Jelly from time to time. Thus, teams must have adequate knowledge of these frameworks.
- In ServiceNow, the data lies in tables for reporting. Since these tables are defined by physically contributing data, the insights obtained aren’t always high-quality. Without correct and reliable information, you will never get the desired results.
- Running extensive reports leads to performance degradation of ServiceNow, impacting query speed, increasing the likelihood of late, out-of-date reports, and crashes
To counter these challenges, organizations integrate ServiceNow with third-part reporting & analytics solutions. Through integration, organizations can use their preferred and/or best-in-class solutions to generate reports and perform analysis.
As purpose-built tools for reporting and analytics, such solutions have more robust capabilities than what is available within ServiceNow.
Furthermore, by using your organization’s existing reporting and analytics solutions, operations can be streamlined because processes for actions such as distributing reports are already in place.
Without integration, distributing ServiceNow reports and/or combining ServiceNow data with other sources usually involves manual data transfers and/or replication. Processes that are both error-prone and time-consuming.
How to Integrate ServiceNow with Purpose-Built Reporting and Analytics Solutions
The best way to integrate ServiceNow data with the wider enterprise is by replicating ServiceNow data to an external database.
By doing so, organizations can use purpose-built – including best-in-class – solutions to run analysis and generate reports. Consequently, analysis and reports on ServiceNow data remain aligned with existing processes and business requirements.
Replicating to an external database also allows organizations to merge ServiceNow data with other data sources. Thus, reports are properly contextualized with the wider organization.
Benefits of Integrating ServiceNow with Reporting Tools
Integrating ServiceNow with purpose-built reporting and analytics solutions provides a number of benefits:
Democratize ServiceNow data and collaborate on reporting and analysis
Data, reports and analysis can be easily, and securely distributed to the departments and people that need them.
Use best-in-class solutions
Analyze, visualize and store data using preferred solutions – well understood by employees and in-line with existing processes – for more extensive reporting and analysis capabilities.
Improve accuracy and reduce manual processes
Automate the extraction and replication of ServiceNow data to, and from an external database to cut down on time-consuming and error-prone manual effort.
Strengthen data security
Leverage integration tools with encryption capabilities to ensure ServiceNow data is protected at-rest and in-transit when extracting and replicating it to reporting and analysis solutions.
ServiceNow Integrations for Enterprise Scale Organizations
Large enterprises generate massive amounts of data and insight to be used around the enterprise. However, massive data volumes make extracting and replicating data to third-party solutions difficult – particularly from ServiceNow.
Building your own integrations to extract and replicate ServiceNow data requires significant internal resources. And from implementation to maintenance, a number of hidden costs quickly escalate over time.
The easiest and most reliable way to extract and replicate massive amounts of ServiceNow data, and integrate it with third party solutions is to use a trusted integration provider.
Perspectium is a trusted integration service and solution provider for ServiceNow integrations. Organizations use Perspectium to create seamless integrations between ServiceNow and a number of popular analytics and reporting solutions such as Power BI and Tableau.
Perspectium’s DataSync extracts and replicates massive amounts of ServiceNow data to an external database – without degrading ServiceNow’s performance.
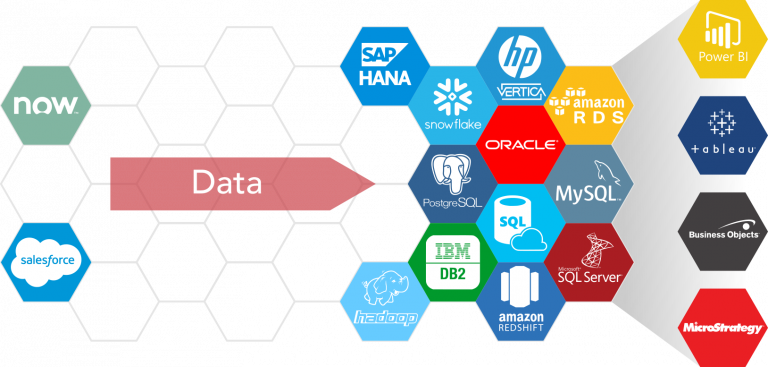
Supported target sources include Amazon Redshift, MySQL, Oracle, PostgreSQL, SAP Hana, SQL Server and Snowflake. The external data store can then be used to populate third-party applications such as analytics and reporting solutions.
Perspectium was created by the founding developer at ServiceNow, David Loo. As well as being a trusted partner of ServiceNow, Perspectium provide integrations to ServiceNow.
ServiceNow uses Perspectium to replicate 10 production instances of ServiceNow into 4 SAP/HANA databases for analysis by Sales, Marketing, Finance, and other departments.


Related Posts
-

To get the most value out of ServiceNow, a number of ServiceNow integration use cases…
-
Improving ServiceNow data availability helps organizations make more productive use of ServiceNow data in analysis,…
-
Effectively managing ServiceNow data and its growth is key to maintaining a healthy ServiceNow instance.…


Related Posts
-
To get the most value out of ServiceNow, a number of ServiceNow integration use cases…
-
Improving ServiceNow data availability helps organizations make more productive use of ServiceNow data in analysis,…
-
Effectively managing ServiceNow data and its growth is key to maintaining a healthy ServiceNow instance.…